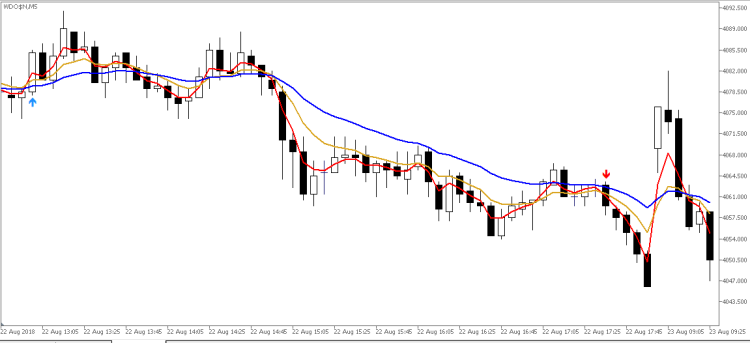
For those who appreciate Richard Wyckoff approach for reading the markets, we at Minions Labs designed a tool derived – yes, derived, we put our own vision and sauce into this indicator – which we called Waves PRO. This indicator provides a ZigZag controlled by the market volatility (ATR) to build its legs, AND on each ZigZag leg, we present the vital data statistics about it. Simple and objective.
This indicator is also derived from the great book called “The Secret Science of Price and Volume” by Timothy Ord (2008).
WHAT EXACTLY DOES THIS INDICATOR DO?
Shows vital VOLUME information on each leg on the Price Chart:
- Total Volume of the leg.
- Average Volume in each candle of the leg.
- Last leg % Delta variation on volume.
- Penultimate leg % Delta variation on volume
WHY IS THIS IMPORTANT?
Volume is one of the most underrated information for a vast majority of the traders worldwide. Obviously not all exchanges provide Volume information on their platform, but if you have this information available, WHY not use it in your favor??
If you don’t know how to analyze or take advantage of the Volume information on your trades, we strongly suggest the reading of the cool book written by Timothy Ord. It will open you mind to a new kind of analysis and enhance your success rate to a new level.
SETTINGS / FEATURES
- ATR period (bars) to analyze on the calculations of the legs. If you don’t know what ATR is, YOU MUST. This is one of the BEST measurements of market breadth you can have on your toolbox. That’s why we used ATR instead of arbitrary values do “break” the legs on our ZigZag.
- Which ATR level do you want to use to break each wave/leg.
- Show (ON/OFF) each wave/swing/leg statistics?
- Show (ON/OFF) Tops & Bottoms lines extended as Support & Resistances?
- How many days do you want for Tops & Bottoms lines?
- Volume Type to use on calculations (Real Volume OR Ticks)?
- Threshold line Style – This is the line plotted on the chart to visually tell you where is the current level that, when hit, will build a new Wave/Leg.
- Swing/Leg Statistics: Ability to turn ON/OFF Total Volume, Average candle Volume, Last Leg % Delta volume, Penultimate Leg % Delta volume.
- Ability to shorten the numbers dividing them by… X
- Decimal points to use for data/numbers.
- Suffix text to apply to transformed numbers.
- Separator character to use on each data element.
- Font Size.
- Vertical Offset for proper viewing.
- % threshold to color strong Swings/Legs.
- Colors for Neutral, Positive and Negative Swings/Legs.
- Styles to be used for Tops & Bottoms lines.
- Show Debug information of the indicator on the Experts tab?
DIDN’T FIND A FEATURE YOU NEED?
No product is perfect for everyone. If you think you need a missing feature from our product just send us a message. We love feedback!
ABOUT US…
Flavio Jarabeck is the owner of MinionsLabs.com, an entrepreneurship focused on leveraging the knowledge and experience of professional traders through automated trading robots, freeing them to seek new opportunities and strategies in new markets and assets.
WHY THE PRICE OF USD 79,00?
This indicator took a LOT of time to be developed. Please download the DEMO (not yet available… sorry) version to be sure that it is the right fit for you. And if it is, we will give you Waves PRO with *1,000 ACTIVATIONS*. So, it will be yours FOREVER!
Live Long and Prosper.


